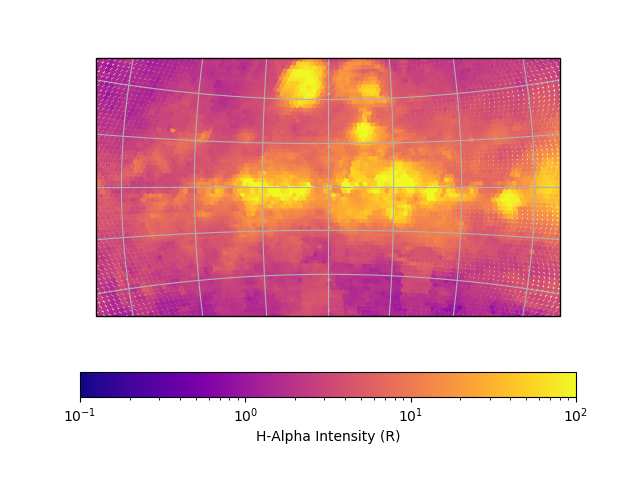
Making Sky Maps with whampy
The SkySurvey class has a method intensity_map that allows for
quick plotting of WHAM beams colored by their intensity with the help of matplotlib:
>>> from whampy.skySurvey import SkySurvey

>>> # Load Survey
>>> survey = SkySurvey()
>>> # Quick Sky Map
>>> fig = survey.intensity_map(colorbar = True)

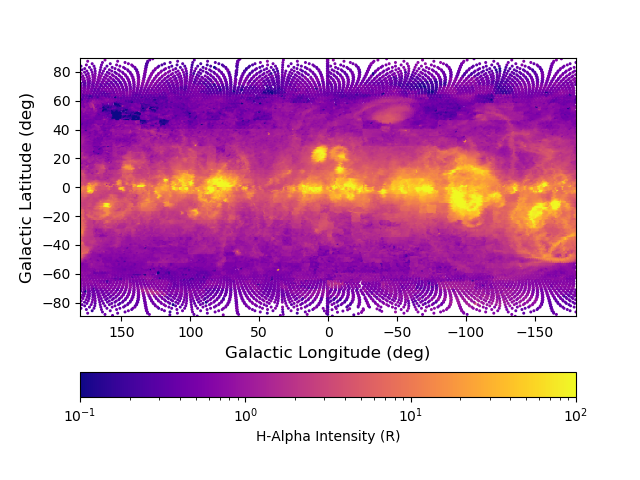
You can provide your own set of figure or axes subplot instances as keywords. This allows you to plot these points onto different projections or over other data:
>>> import matplotlib.pyplot as plt
>>> fig = plt.figure()
>>> ax = fig.add_subplot(111)

>>> fig = survey.intensity_map(ax = ax, fig = fig,
...                         colorbar = True,
...                         cbar_kwargs = {"orientation":"horizontal"})
Different map projections are also support, especially with the help of the transform keyword.
This can done with either astropy WCSaxes or using cartopy. this method also finds a best guess
default size for the plot markers. This can also be set manually with the keyword s or altered
by some factor using the s_factor keywword:
>>> import cartopy.crs as ccrs
>>> fig = plt.figure()
>>> ax = fig.add_subplot(111, projection = ccrs.Stereographic())

>>> lrange = [50,-50] # Longitude Range
>>> brange = [-20,20] # Latitude Range
>>> fig = survey.intensity_map(ax = ax, lrange = lrange, brange = brange,
...                             transform = ccrs.PlateCarree(),
...                             colorbar = True,
...                             cbar_kwargs = {"orientation":"horizontal"})