Stacking Spectra via bootstrap with whampy
The SkySurvey class has a method :method:`~whampy.whampyTableMixin.stack_spectra_bootstrap` to quickly stack spectra via a bootstrap estimation method.
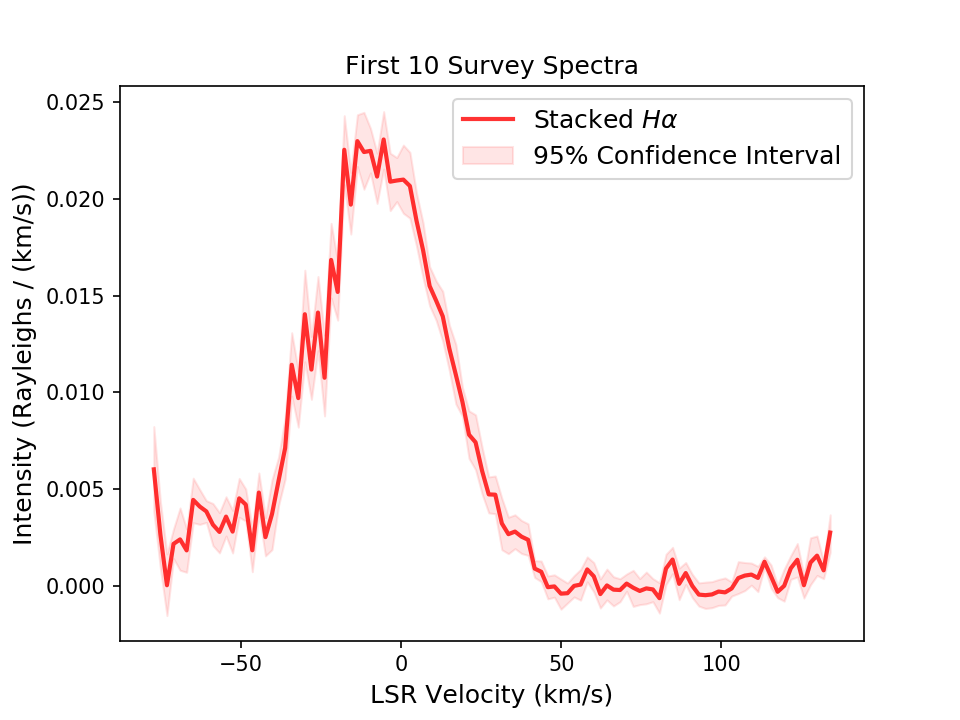
For example, we can stack the first 10 spectra in the survey:
>>> from whampy.skySurvey import SkySurvey

>>> # Load Survey
>>> survey = SkySurvey()

>>> # Stack first 10 spectra
>>> stacked_spectrum = survey[0:10].stack_spectra_bootstrap(set_name = "First 10 Survey Spectra")

>>> # Plot results
>>> import matplotlib.pyplot as plt

>>> fig = plt.figure()
>>> ax = fig.add_subplot(111)
>>> ax.plot(stacked_spectrum["VELOCITY"][0],
...         stacked_spectrum["DATA"][0],
...         color = 'r',
...         lw = 2,
...         alpha = 0.8,
...         label = r"Stacked $H\alpha$")
>>> ax.fill_between(stacked_spectrum["VELOCITY"][0],
...                 stacked_spectrum["CI"][0][0],
...                 stacked_spectrum["CI"][0][1],
...                 color = "r",
...                 alpha = 0.1,
...                 label = "95% Confidence Interval")

>>> ax.set_xlabel("LSR Velocity (km/s)", fontsize = 12)
>>> ax.set_ylabel("Intensity (Rayleighs / (km/s))", fontsize = 12)
>>> ax.set_title("{0}".format(stacked_spectrum["NAME"][0]),
...              fontsize = 12)

>>> leg = ax.legend(fontsize = 12)